01 / 2025 · arias tech solutions
Marine ecosystem monitoring
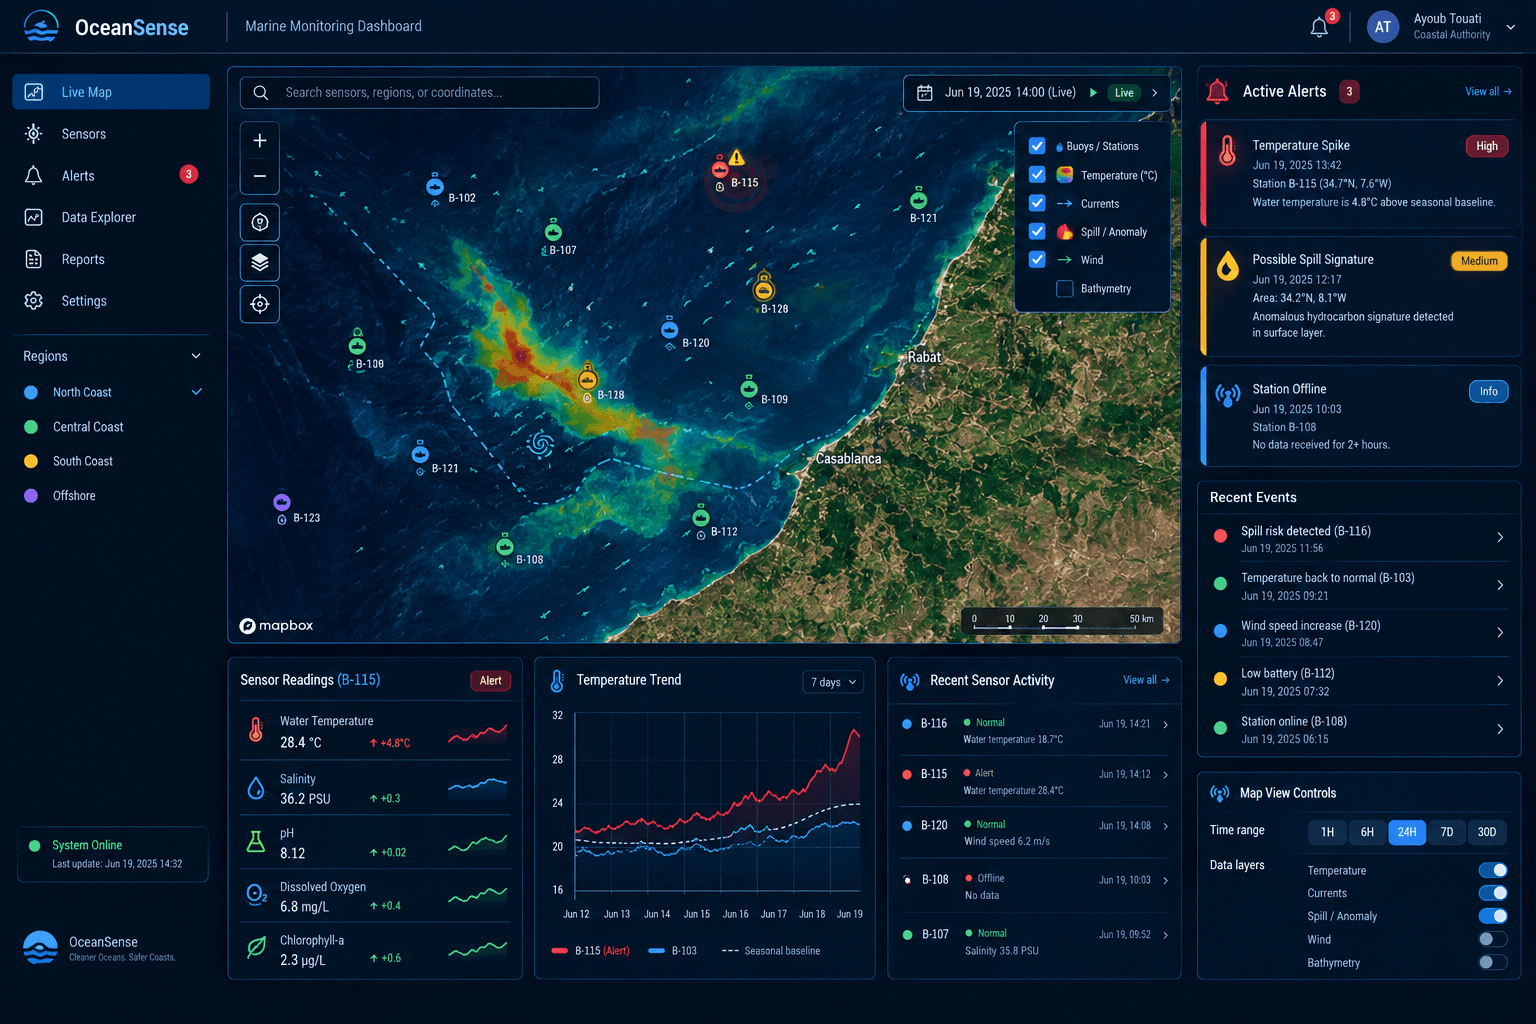
Buoys and satellites, streaming sensor data into a map that has to stay readable while it moves.
the brief
Give researchers and coastal authorities one screen for live sensor readings across a large stretch of water, with alerts when something goes wrong — a temperature spike, a spill signature, a station going quiet.
what I did
Angular and Mapbox GL on the front, NestJS ingesting and aggregating on the way in, Mongo for the time series. The important decision was what not to send: the server decides what counts as an event against a seasonal baseline, and the socket carries events, not raw points. Alerts fan out to email and SMS with thresholds the client can edit themselves.
what broke
My first version plotted every reading faithfully and pinned a laptop CPU inside a minute. The second version throttled the socket, which just moved the freeze around. Neither was a rendering problem — I was sending the browser a question instead of an answer.
what I'd change
We shipped alerting before anyone had defined what normal looked like, so the first month was me tuning thresholds by hand in production. Next time: two weeks of collecting baseline data before a single alert rule is written.